Use a Pick Chart to Make Better Decisions
View my You Tube PICK Chart Video . - 5 minute demonstration of creating a PICK chart using a drag and drop Excel Sheet. It is easy - try it.
Click Here to Download Excel Template
This type of chart is a Lean Six Sigma tool, developed by Lockheed Martin, for organizing process improvement ideas and categorizing them. It is also a powerful and simple decision support tool.
It helps you quickly decide what is the most beneficial option in terms of Highest Payoff for Least Effort.
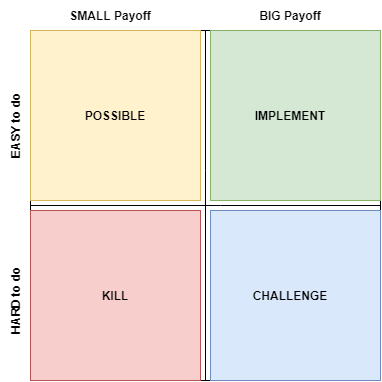
When faced with multiple improvement ideas or options it may be used to determine the most useful. There are four categories on a 2 by 2 matrix; horizontal is scale of payoff (or benefits), vertical is ease of implementation.
By deciding where an idea or decision option falls on the chart four proposed project actions or decisions are provided; Possible, Implement, Challenge and Kill (thus the name PICK).
- Possible - Low Payoff, Easy to do
- Implement - High Payoff, Easy to do
- Challenge - High Payoff, Hard to do so challenge it to see if there is an easier way e.g. break down the solution into smaller components
- Kill Low Payoff, Hard to do
The vertical axis, representing ease of implementation would typically include some assessment of cost to implement as well.
Back To 'Types of Decision making' page
Back to 'Business Intelligence' Home Page