|
What is a Pivot TableA pivot table is a multi-dimensional view of data. For example, for example, sales by region, sales by sales rep, sales by product category, sales by month, etc.
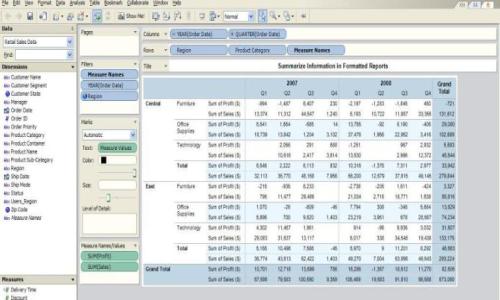
It is like a cross tabulation or crosstabs report They first became available in spreadsheet programs such Lotus 123 in the 80s. Now Microsoft Excel has the capability. The number of dimensions available for analysis is sometimes a limiting factor with some software programs. Some data visualisation programs such as Tableau go a great deal further. You can drag and drop the data fields onto the multidimensional frame and do the various calculations such as sum, average, count, max, min etc. Below is an example (Click on image to see enlarge image).
Go to Top of the Pivot Tables page Return to An Overview of Business Intelligence Software |